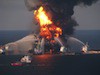

Today phase two of the BP trail started, which will cover the size of the spill and BP’s efforts to contain it. The outcome might mean billions of dollars in fines to the company and its co-defendants.
It was obvious from the days after that spill that the information on the size and scale of the spill was not only hard to estimate but there were clearly efforts being made to obscure the information. Our friends at Skytruth played a crucial role in in shedding light on the true magnitude of the spill and in an attempt to keep BP and the Coast Guard honest. Check out their chronology here.
Below are graphic illustrations of the flow rates and scale of the spill that Surfrider created while the oil continued to spill, the spill rate was continually underestimated, and while BP made many failed attempts to contain the flow of oil that ultimately took 87 days before to stop.
You can see that while the Coast Guard continued to reduce their estimation of the flow rate and total size of the spill, Skytruth used aerial images and basic physics to develop a more realistic estimate in the first two weeks of the spill.
As you can see from this graph even the SkyTruth estimates, while much higher than the Coastguards estimates, also turned out to be conservative compared to the Naitonal Incident Commands estimates in the end.
As these graphics show the initial flow rates were dramatic underestimates. It defintely begs the question whether the spill could have been stopped earlier if the spill rates were properly estimated and not obscured by BP. My guess is that BP anticipated this day in the courts when they began playing these games. It will be interesting to see what the courts ulitmately decide.
Tune in to Surfrider's Not the Answer campaign to follow the ongoing oil drilling issues faces our coasts and oceans.